 Trading Reps
Lesson 7 of 31 · Zero to reading a chart
How to Read a Stock Chart: It's Just Dots
A chart is one dot for every price at every time - a record of trades in order, not a drawing with a meaning built in - and the first three things to read are the ticker, the date and the timeframe.
A chart looks complicated. It is dots. Want to build one?
Most people meet a chart already finished. A wall of shapes and numbers.
It feels like something you need to be taught to decode.
Nothing about it is complicated once you have watched it get made.
You already know the only ingredient. Every price is a trade.
Two people agreeing, one after another, all day.
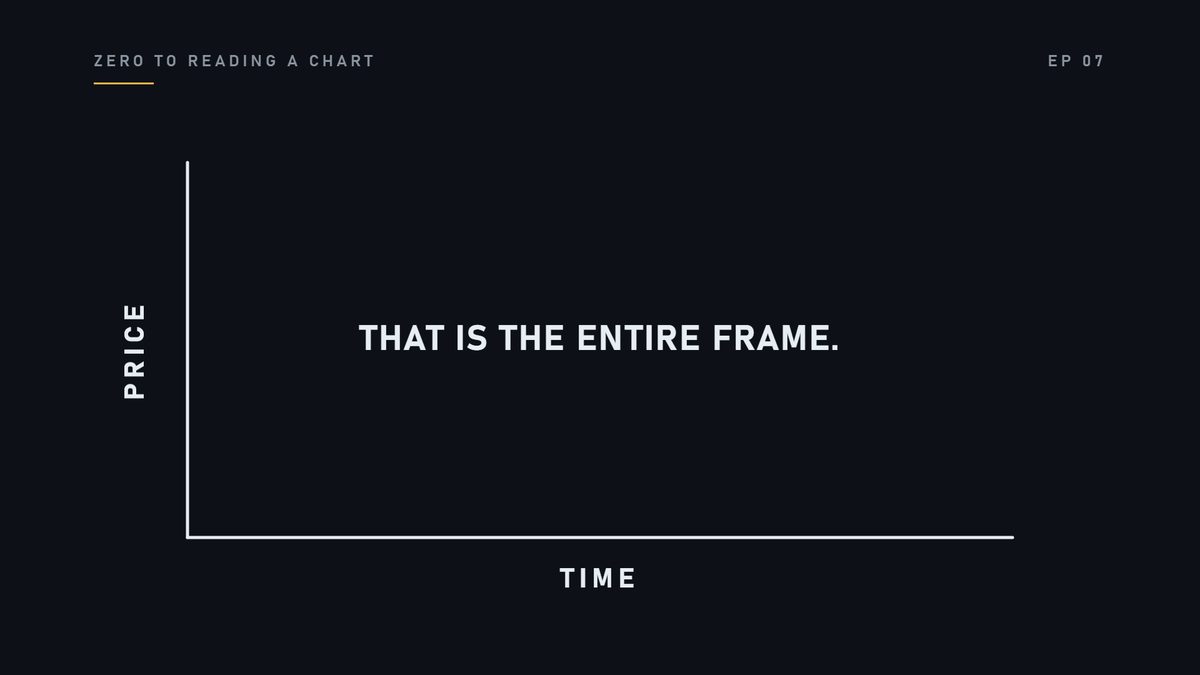
Start with nothing. Two edges. Up the side: price. Along the bottom: time. That is the entire frame.
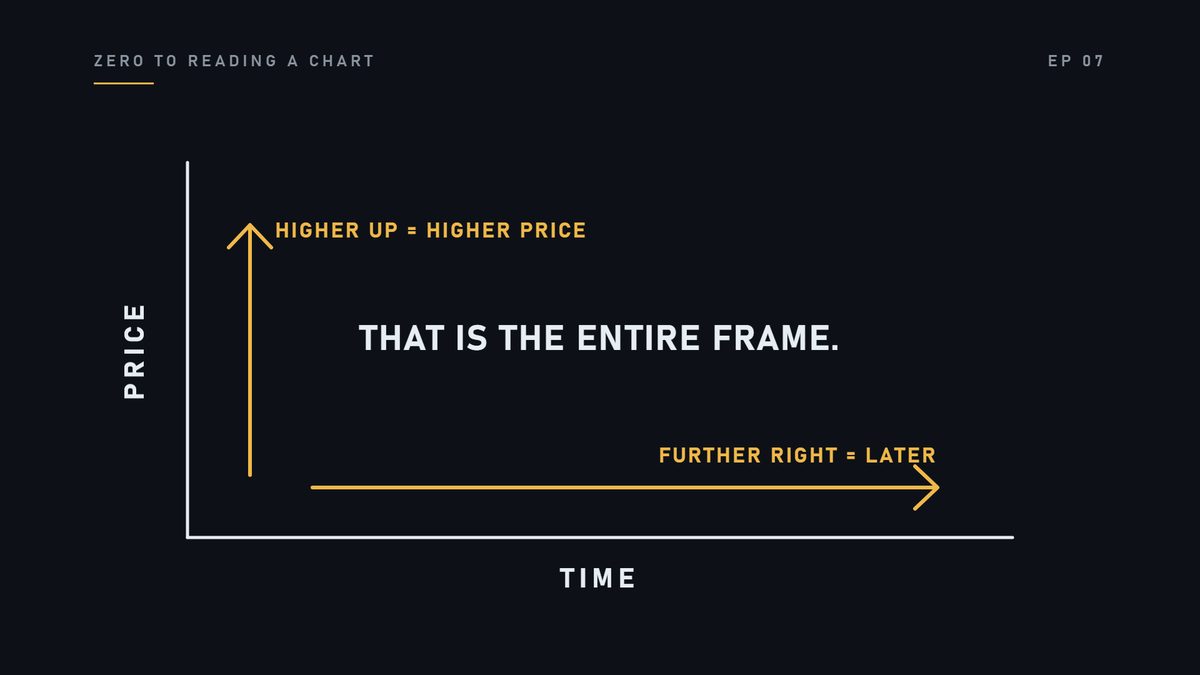
Higher up means a higher price. Further right means later in the day.
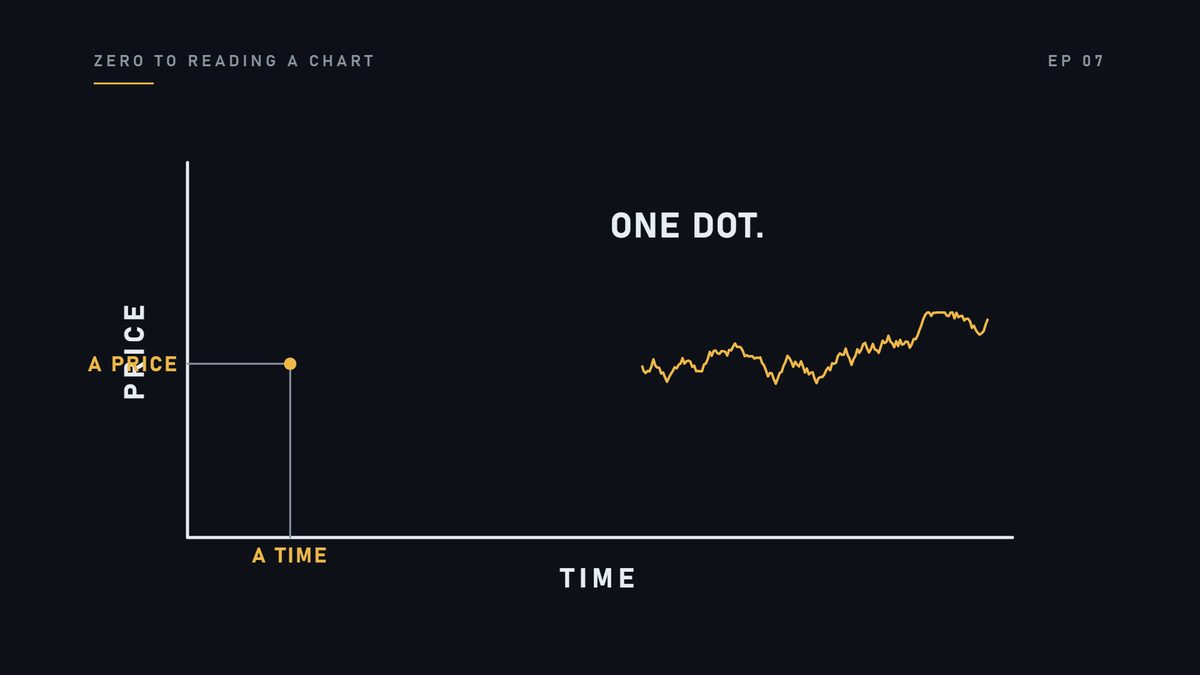
Now one trade happens. It has a price, and it happened at a time. So it goes in one place. Here. One dot.
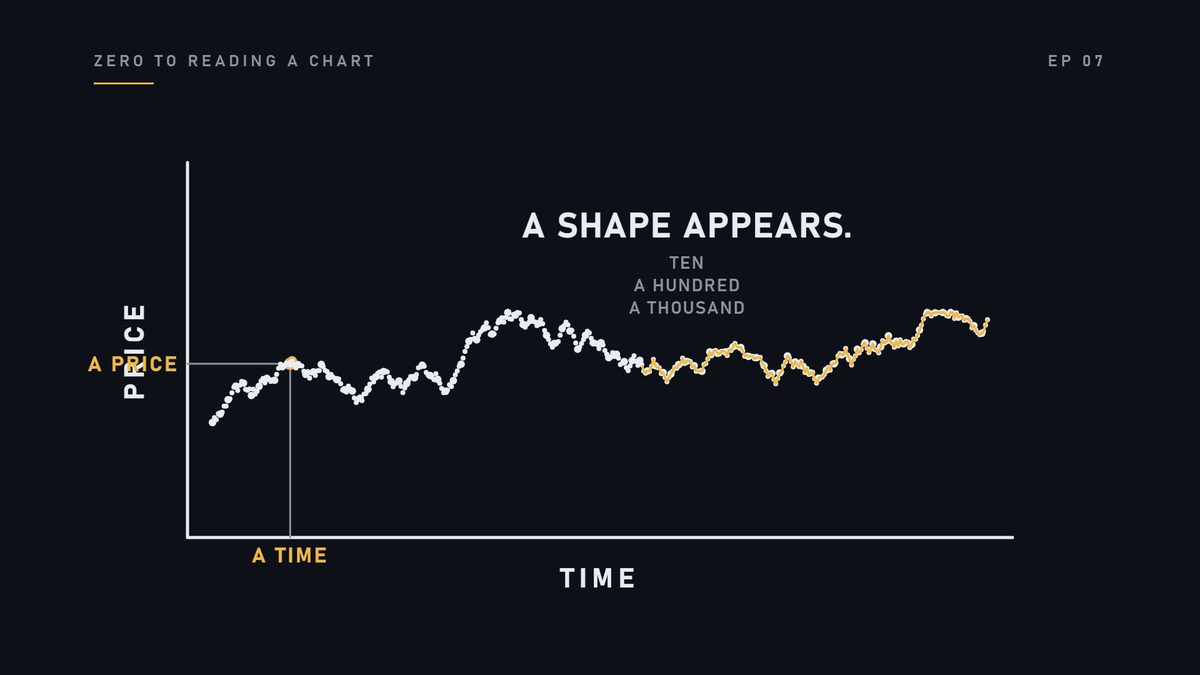
Another trade. Another dot. Ten. A hundred. A thousand. And with no effort from anybody, a shape appears.
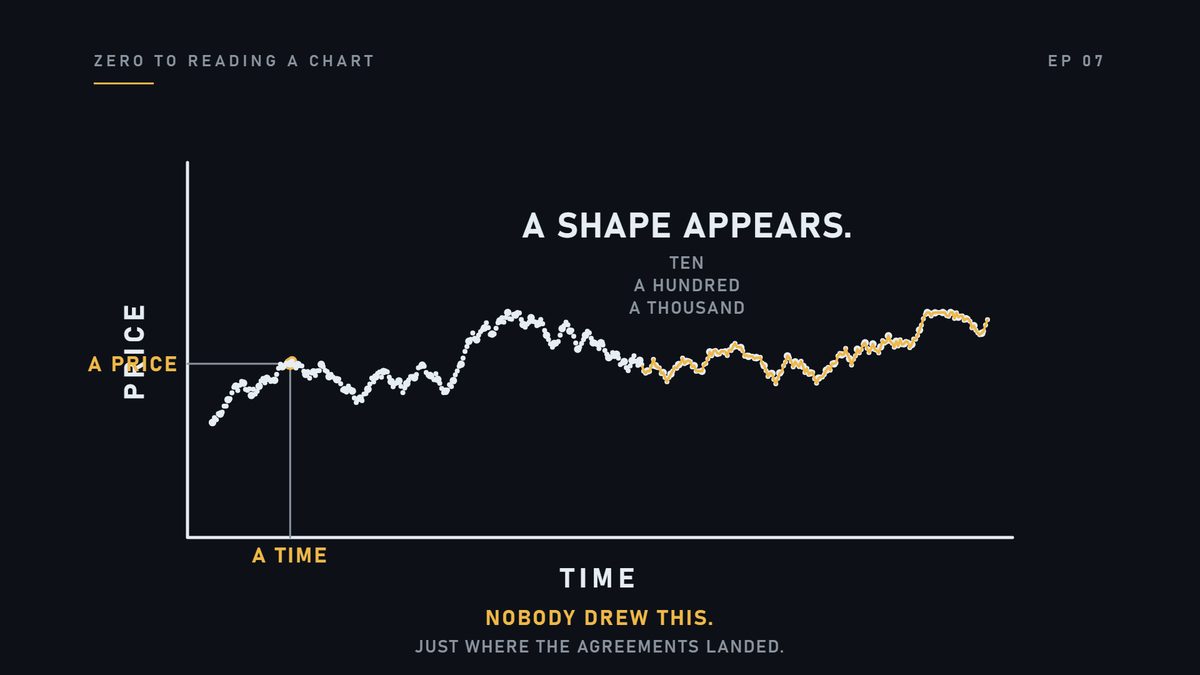
Nobody drew that shape. It is just where the agreements landed.
Join the dots and you get a line. That is the simplest chart there is. One line, following the price through the day.
And here is the real thing. Same idea, real company, real day. Let me point at three things, because nobody ever does.
Bottom left: the ticker, and the date. That tells you which listing, and when. Never read a chart without reading those first.
Next to them: the timeframe. It says one minute. Every point on this chart covers one minute of trading. Change that setting and the same day looks different. We will do exactly that in a few episodes.
And up the right side: the price axis. Those are the actual dollars. Everything on the chart is measured against that edge.
Now watch this. Here is the same day again, and I am going to take something away. The line disappears, and the dots come back.
And you can see it. The chart was never a drawing. It was always a record of things that happened, in order.
A chart is one dot for every price at every time. That is the entire idea.
Here is the mistake. People treat the shape as if somebody designed it. As if the chart is a picture with a meaning built in.
It is a record. It shows what happened.
It was not drawn to tell you anything. It does not know you are looking at it.
Open any chart and find three things before anything else. The ticker, the date, and the timeframe.
Remember this. A chart is one dot for every price at every time. That's the entire idea.
Check yourself
- What is on the side axis?
- Price.
- What is along the bottom?
- Time.
- What is one dot?
- One price, at one time.
Next lesson: A candle is four numbers.
For learning only. Not financial advice, not signals, not stock picks.