 Trading Reps
Lesson 10 of 31 · Zero to reading a chart
Green Candle vs Red: Green Does NOT Mean It Went Up
A candle's colour compares its close to its own open and to nothing else - a red candle can close above yesterday's close, and the colours are a setting on the chart, not a fact about the stock.
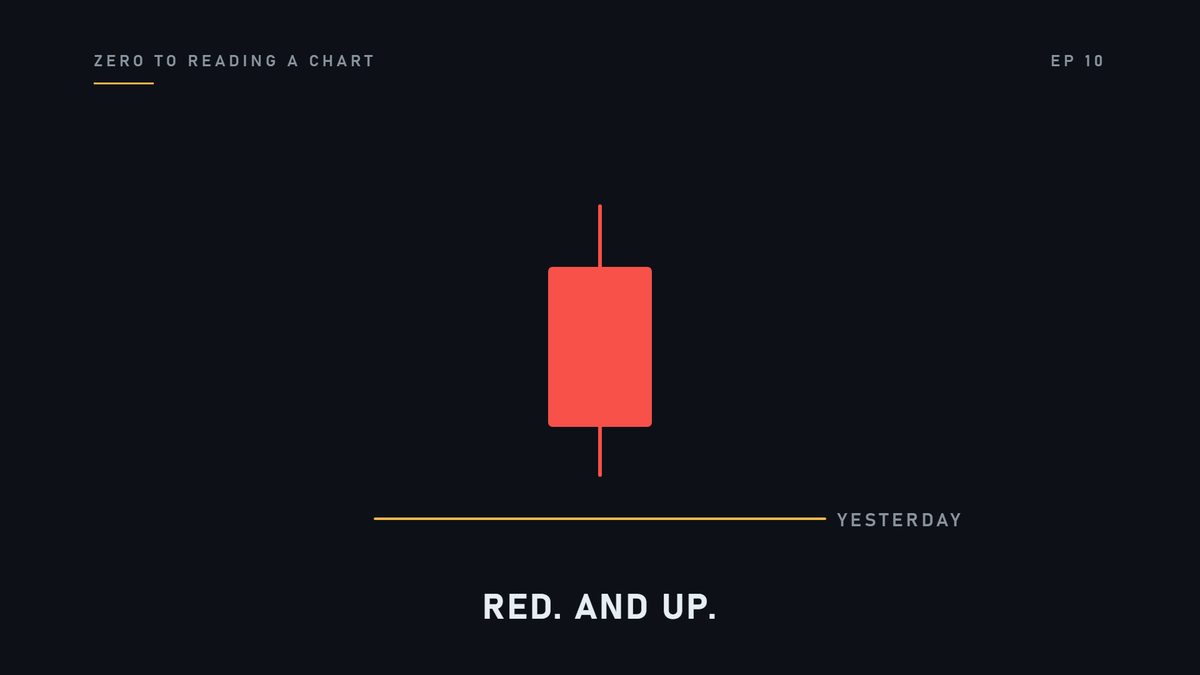
This candle is red. So the stock went down today. Yes?
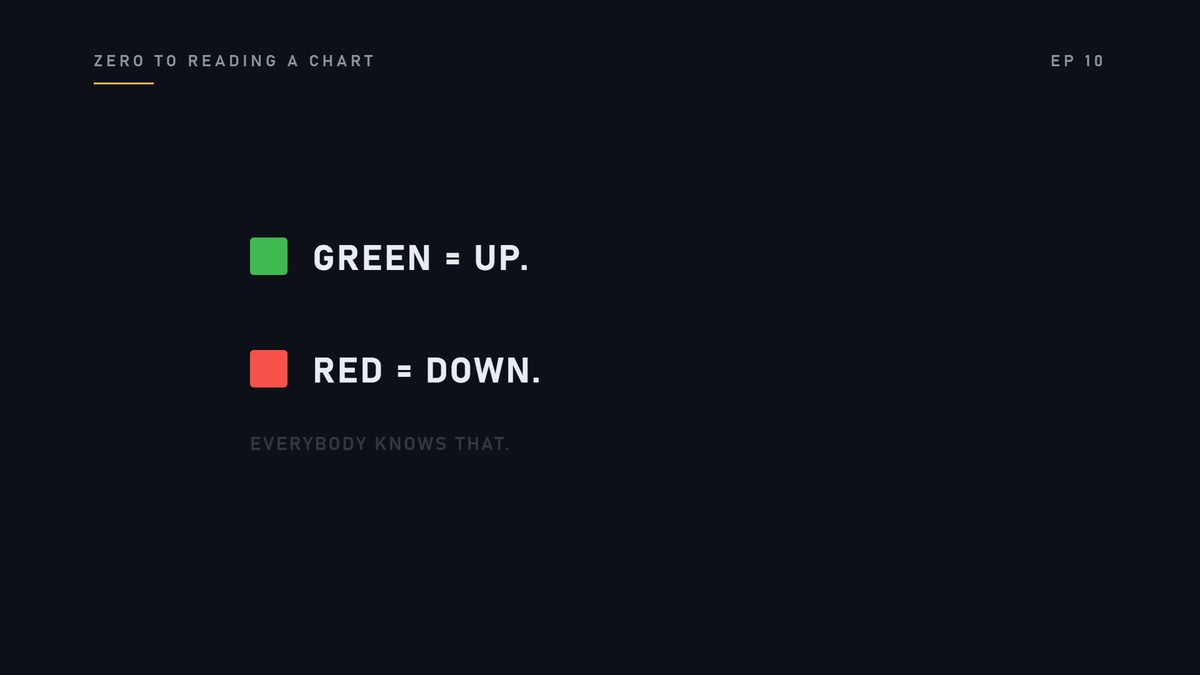
Green is up. Red is down. Everybody knows that.
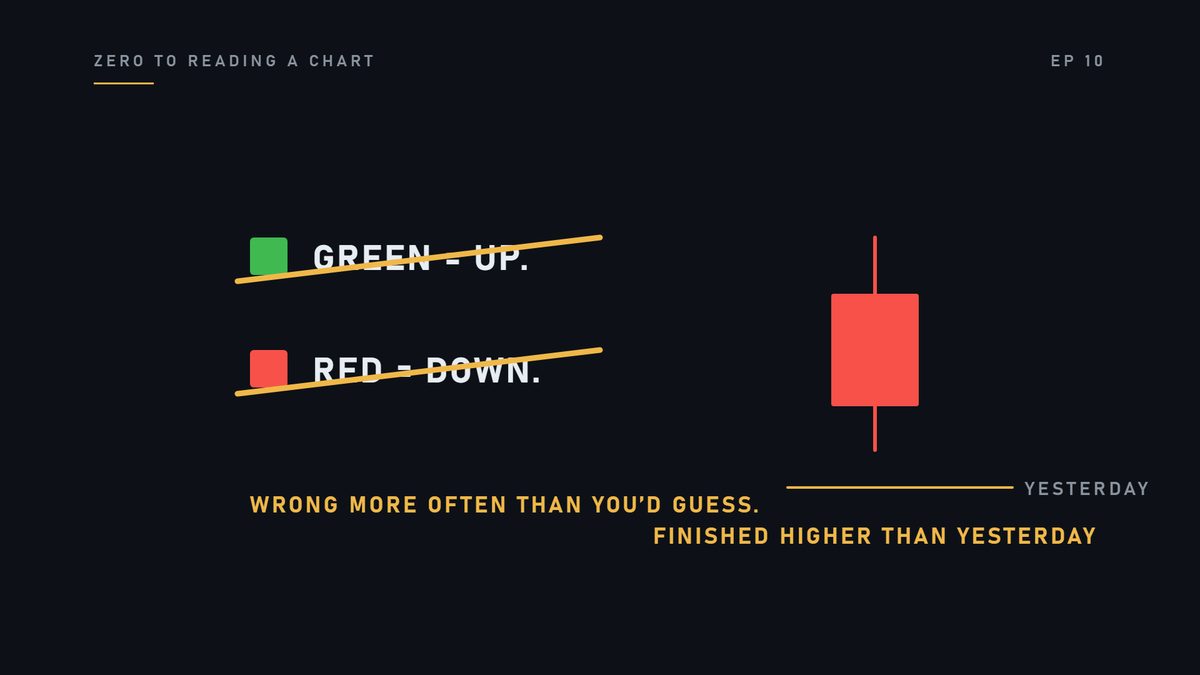
And it is wrong more often than you would guess. This red candle finished the day higher than it finished yesterday.
Last time: the body runs from the open to the close.
Keep that, because the colour is about nothing else.
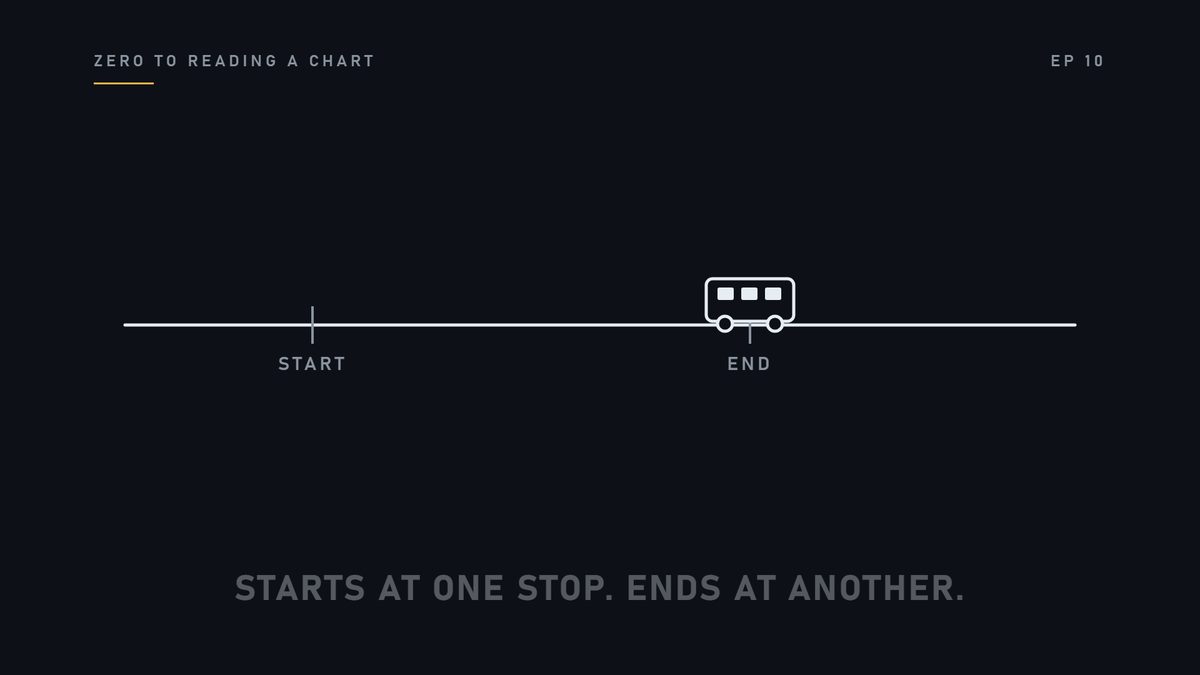
Think of a bus. It starts its route at one stop and ends at another.
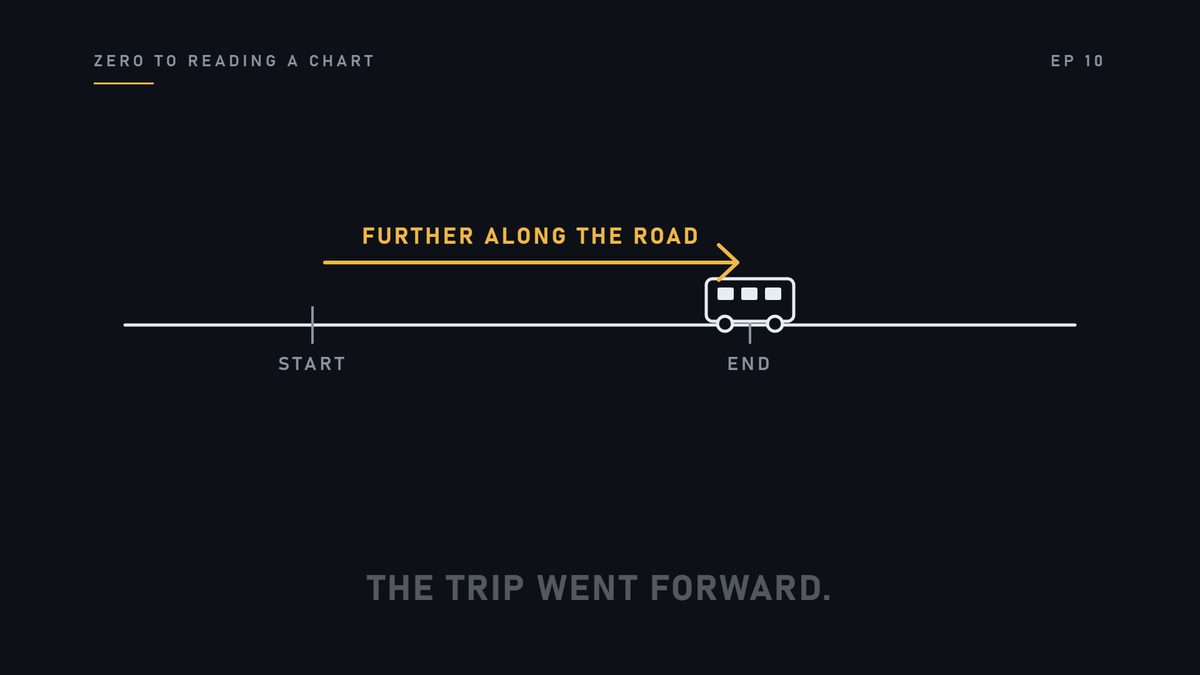
If the last stop is further along the road, the trip went forward.
The colour of a candle is only that. Did this candle end further up than it began? Green. Further down? Red.
Where the bus starts this morning has nothing to do with last night's stop.
Somebody could have driven it across town overnight.
Same with a candle. It compares its close to its own open. It does not look at yesterday. It cannot see yesterday.
So a candle's colour compares two numbers: this candle's close and this candle's open. That is the whole rule.
Here is the real thing. A daily chart. Look at the last candle.
It is red. It closed below where it opened this morning.
Now watch this line. This is where the price finished the day before. Yesterday's close.
Look where today's red candle closed. Above it.
Red. And up on the day.
It opened high, drifted down through the day, and still finished above yesterday.
The colour told you about the trip from open to close.
It said nothing about yesterday, because it never looked. And this is not a rare day. It happens on ordinary charts all the time.
And one more thing. Watch the same candle again.
Now it is white. Now it is one colour. Same four numbers. Nothing about the day changed.
The colours are a setting on the chart, not a fact about the stock.
You will also hear green called bullish and red called bearish. Same setting, other words.
Colour compares this candle's close to this candle's open.
It compares it to nothing else, and you can switch it off.
Here is the mistake. Somebody glances at a screen, sees red, and says: it's down today.
Down from what? From this morning's open, maybe. From yesterday, the colour does not know.
The screen is not lying. It is answering a different question.
Read the close against yesterday's close before you say up or down.
Find a red candle that finished above yesterday's close. There is one on almost every chart.
Remember this. The colour compares the close to the open of that same candle. It compares it to nothing else.
Check yourself
- What two numbers does the colour compare?
- This candle's close and this candle's open.
- Can a red candle close higher than yesterday?
- Yes. The colour never looks at yesterday.
- Are the colours a fact or a setting?
- A setting.
Next lesson: Same stock, two charts.
For learning only. Not financial advice, not signals, not stock picks.