 Trading Reps
Lesson 11 of 31 · Zero to reading a chart
Chart Timeframes: Same Stock, Two Opposite Stories
A timeframe is the size of the box the trades go in; change it and the picture changes, the trades underneath do not.
Two charts. Same company. Same day. One says up. One says down. Which one is lying?
Neither. Both charts are drawn from exactly the same trades. Only the boxes are different.
You have met the label in the corner. It decides how long one candle's window is. Today: what that label does to the picture.
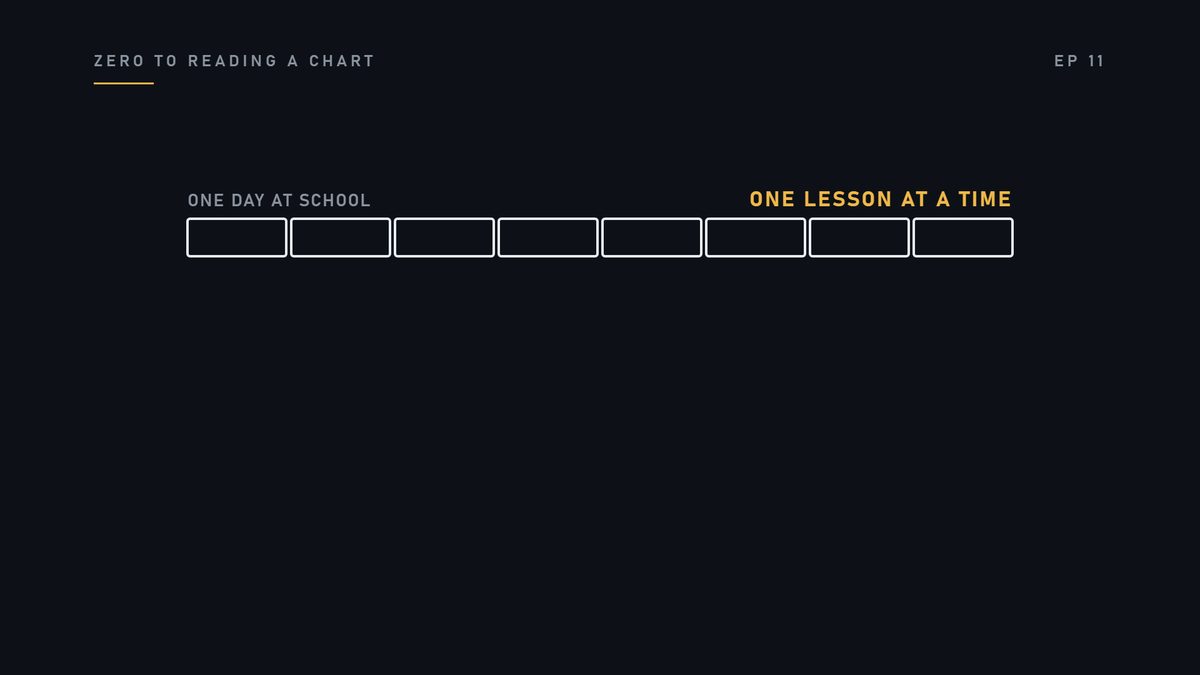
Think of a day at school. You could describe it one lesson at a time.
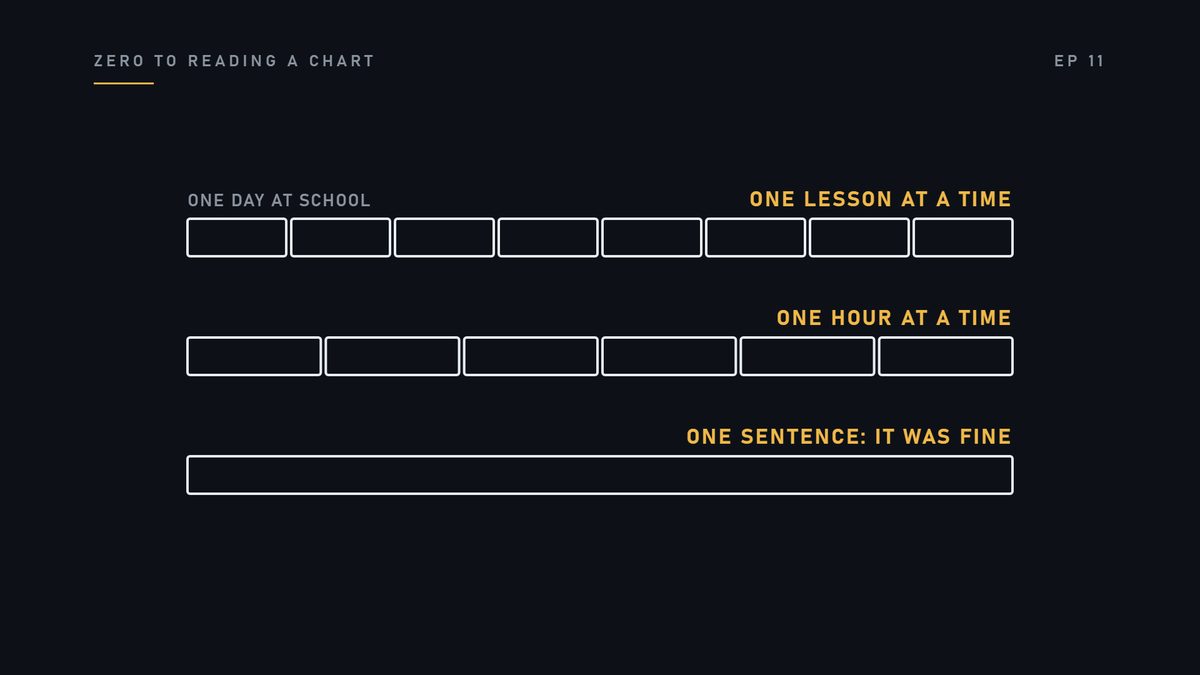
Or one hour at a time. Or as one sentence: it was fine.
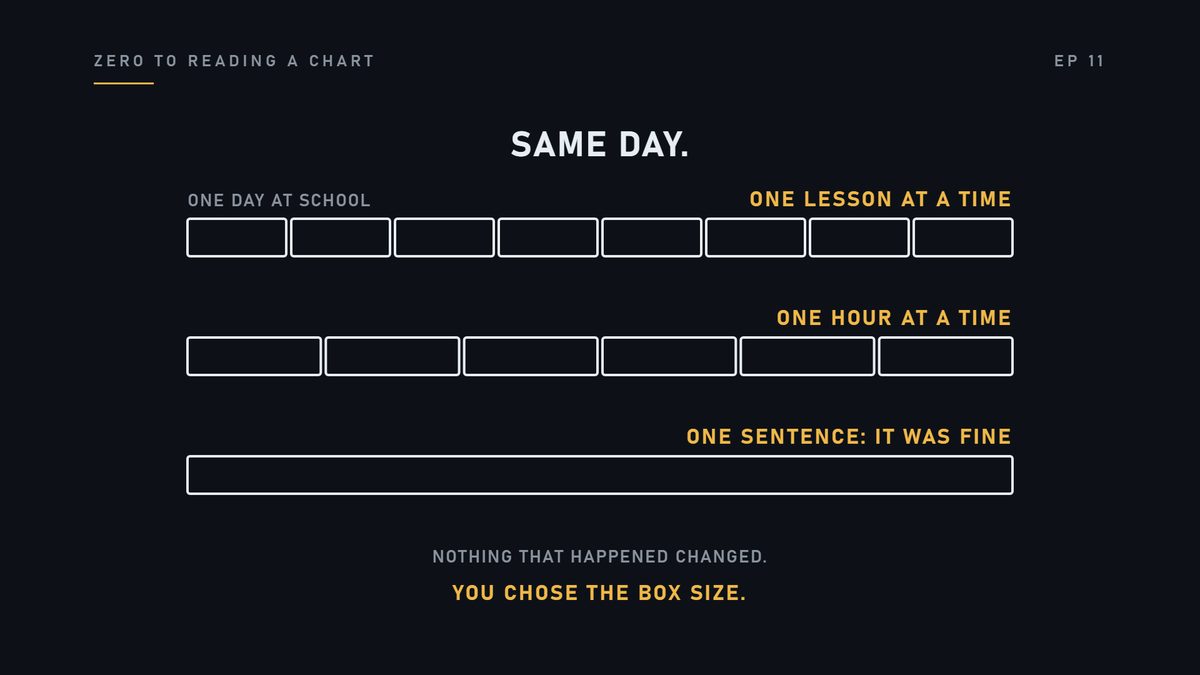
Same day. Nothing changed. You just chose the size of the box.
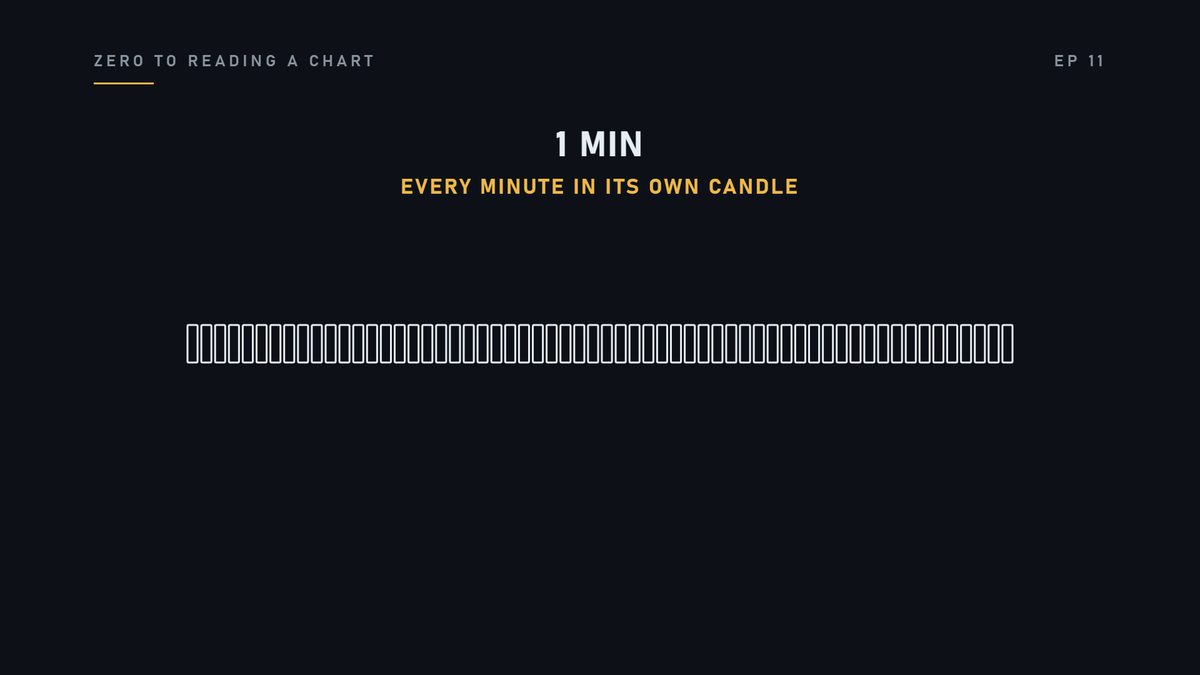
A timeframe is the size of the box. A one-minute chart puts every minute in its own candle.
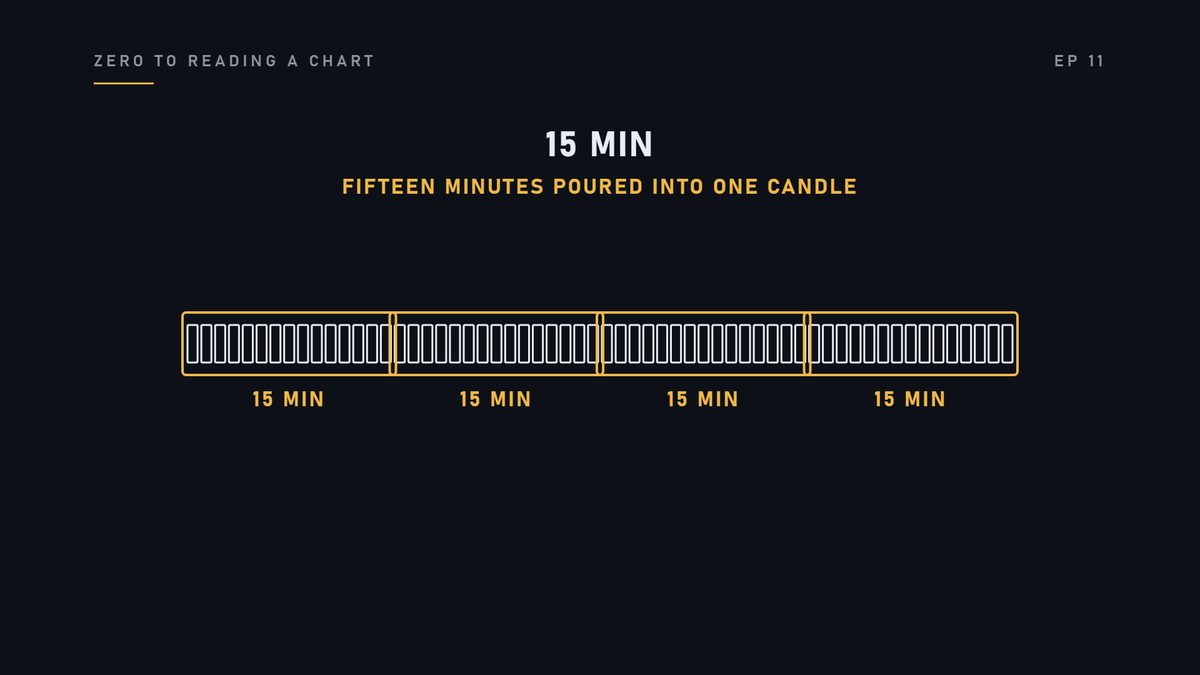
A fifteen-minute chart pours fifteen of those minutes into one bigger candle.
A daily chart pours the whole day into one.
So take a fifteen-minute candle and crack it open. Fifteen one-minute candles fall out.
Their first open is its open. Their highest high is its high.
Their lowest low is its low. Their last close is its close.
Four numbers, from fifteen smaller sets of four.
Here is the real thing. One real day, fifteen minutes a candle. This one is green. It closed above where it opened.
Now we open it up. Here are the fifteen one-minute candles inside it.
Look at the middle. Red. Red. Red. Minute after minute, it was falling.
So was it going up, or going down?
Both. On the fifteen-minute chart, that window went up.
On the one-minute chart, most of that window went down.
Nothing is wrong with either chart. They are answering different questions.
And here is the whole day, as one daily candle. One shape.
Open it, and the entire session falls out. The minutes you saw, and all the rest.
One box, or three hundred and ninety-one. The same trades.
A timeframe is a box size. Change it and the picture changes. The trades underneath do not.
Here is the mistake. Somebody looks at one timeframe and calls it the truth.
It is one box size. A different box shows a different picture. Neither is wrong.
Bigger boxes give you context. Smaller boxes give you detail. Know which one you are holding.
Find any green candle. Switch to a smaller timeframe. Count the red ones inside it.
Remember this. The timeframe changes the container, not the data. Same trades, different boxes.
Check yourself
- What does the timeframe change?
- The size of the box. Not the trades.
- Are the trades different on the two charts?
- No. Same trades, different boxes.
- Which timeframe is the truth?
- Neither. Each is one box size.
Next lesson: 9:30 to 4:00, all of it.
For learning only. Not financial advice, not signals, not stock picks.