 Trading Reps
Lesson 25 of 31 · Zero to reading a chart
Thin Stocks: Some Charts Are Fiction
A price is the last trade, and every minute on a chart is built from some number of trades. On a busy stock that is hundreds every minute; on a thin one there are empty minutes and single-figure counts, so a price or a long spike can be made by a handful of trades almost nobody paid. Count the empty minutes before reading the shape.
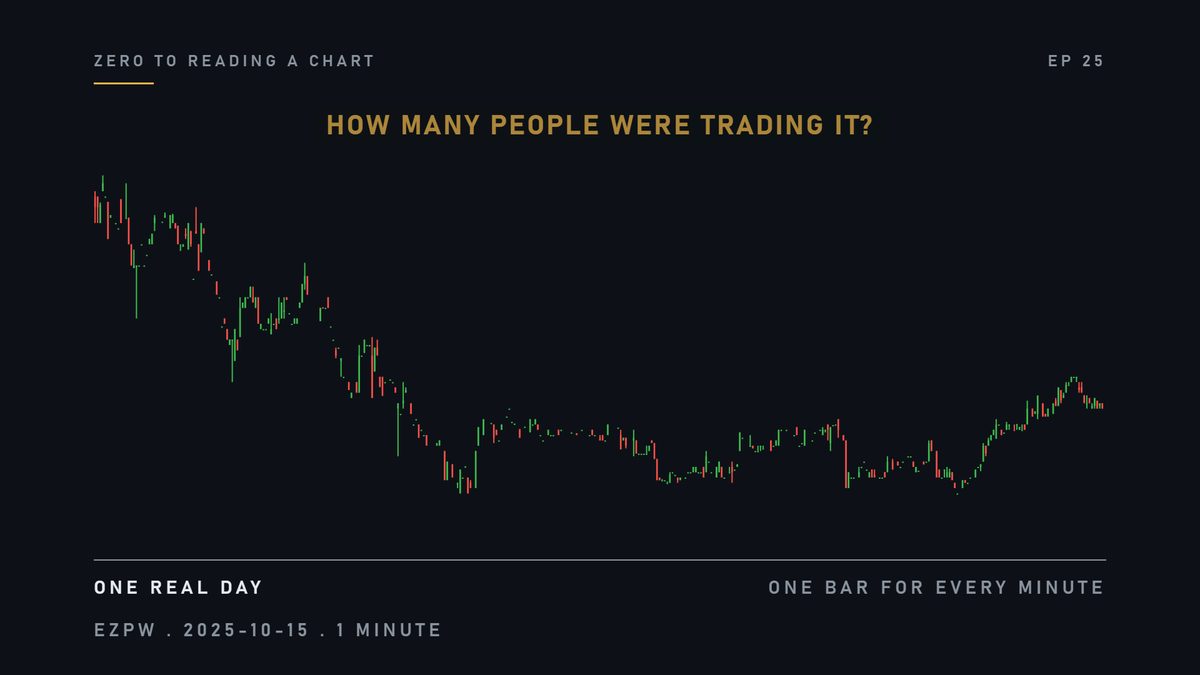
This chart shows a stock moving all day, with long, thin spikes. How many people were actually trading it?
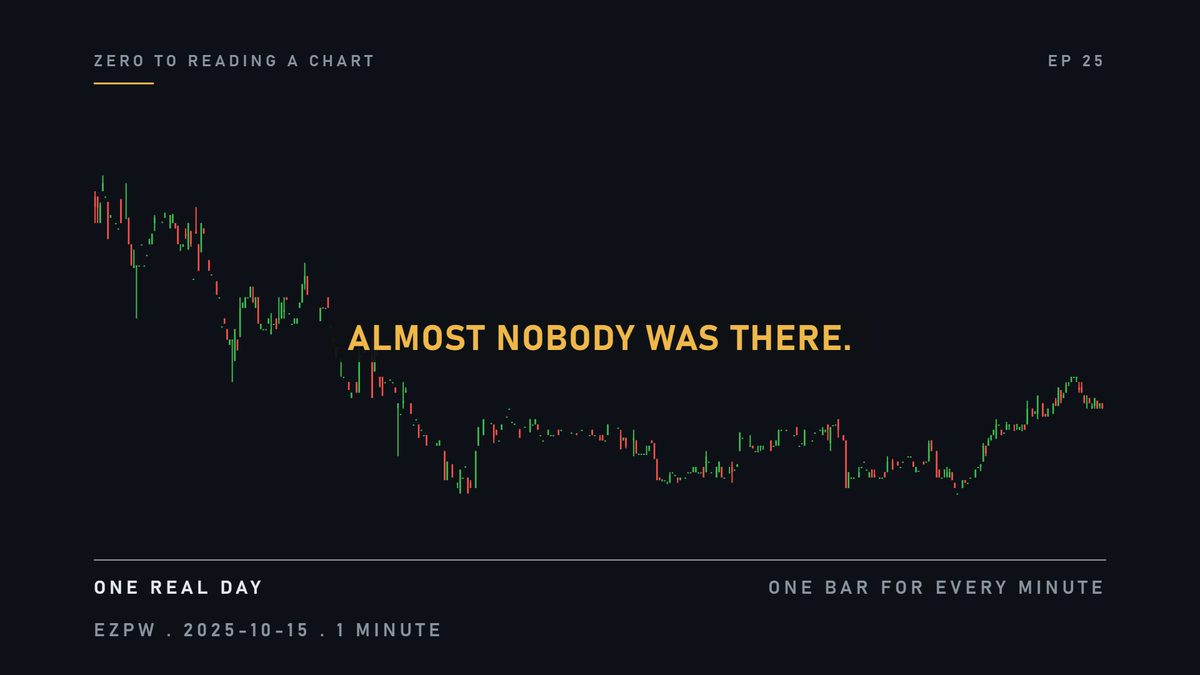
Almost none. Once you know that, the chart stops meaning what it seemed to mean.
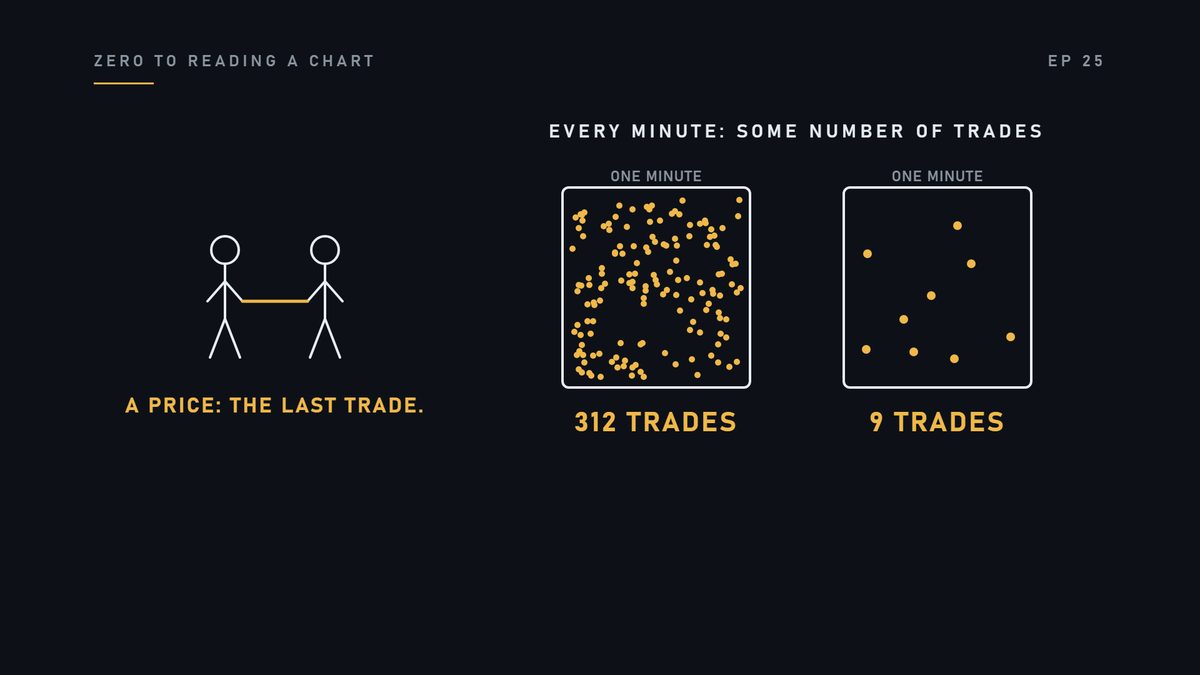
One reminder. A price is the last trade: two people agreeing. And every minute is built from some number of trades. Sometimes hundreds. Sometimes nine.

Imagine two shops selling the same phone. The first has a thousand in stock. You walk in, pay the normal price, and leave.
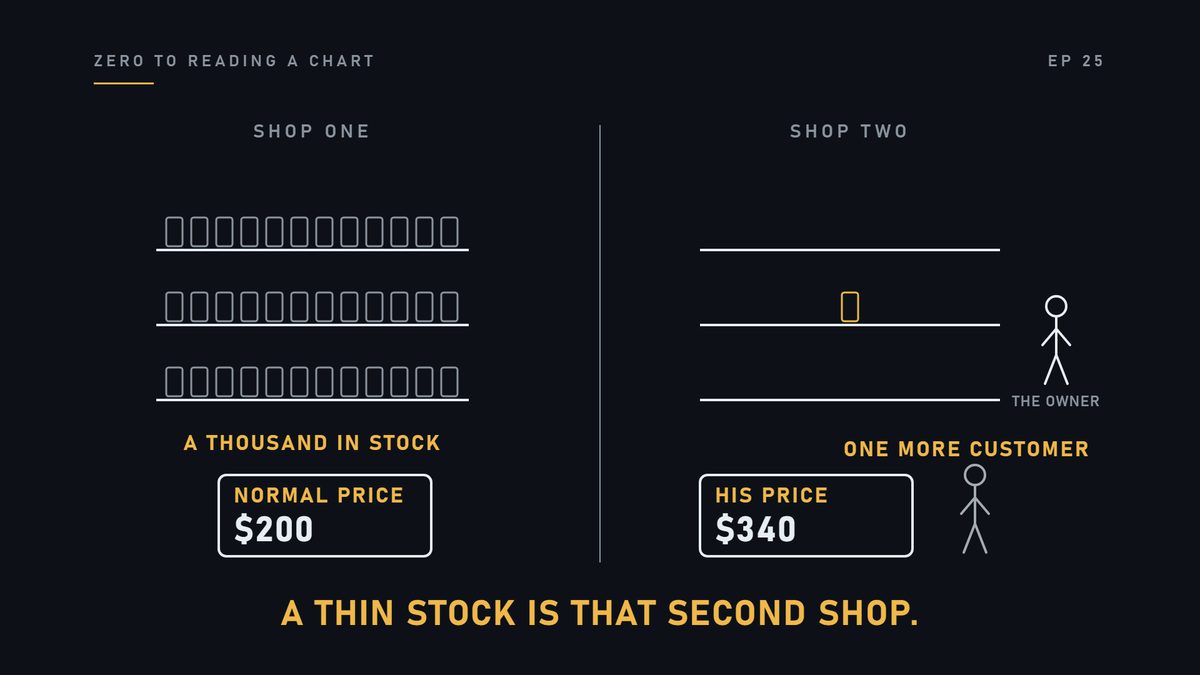
The second shop has one phone. Whatever price the owner says, that is the price. One more customer, and it can change completely. A thin stock is that second shop.
Here is a busy one. Under the chart is a count: how many trades happened in each minute.
Hundreds, every single minute of the day, without a gap. The bars above are solid and connected.
Now a thin one. Same market, same six and a half hours, same count underneath.
Look at the holes. Seventy-one minutes of this day had no trade at all. Not a quiet minute. No trade.
And where there are trades, look how few. Twenty-five in a typical minute. Sometimes nine. Sometimes five.
Here is why that chart can be fiction. Take eight minutes past ten. A price printed on nine trades, and a hundred and eighty-nine shares.
That price sits on the chart looking like every other price. And this long thin spike, at nine forty-six? Eleven trades. Not a crowd changing its mind.
A chart built from a handful of trades shows a price almost nobody paid.
Here is the mistake. Somebody reads a wild chart on a quiet stock as if it were busy.
A big wick means a big fight. A spike means real interest. In a thin stock, it can mean a handful of trades.
So before you read any chart, check three things. Does the count underneath have holes?
Are there hundreds of trades a minute, or single figures? Are the bars connected, or scattered with thin spikes?
Next chart you open, look at the count underneath first, and find the holes.
Remember this. A chart built from a handful of trades shows a price almost nobody paid. Count the empty minutes first.
Check yourself
- What makes a chart thin?
- Very few trades, and minutes with none at all.
- In a thin stock, what can a long spike be caused by?
- A single order arriving when nobody else is there.
- What should you check before you read a chart's shape?
- Whether any minutes are empty.
Next lesson: Market Cap Explained: A $1 Stock Is Not Cheap.
For learning only. Not financial advice, not signals, not stock picks.