 Trading Reps
Lesson 29 of 31 · Zero to reading a chart
Support and Resistance: Draw the Line Before I Do
A level is a price a lot of people are watching - not a floor, a ceiling or a force - and the twenty-day high is one anyone can compute and everyone gets the same answer; fewer lines, on purpose.
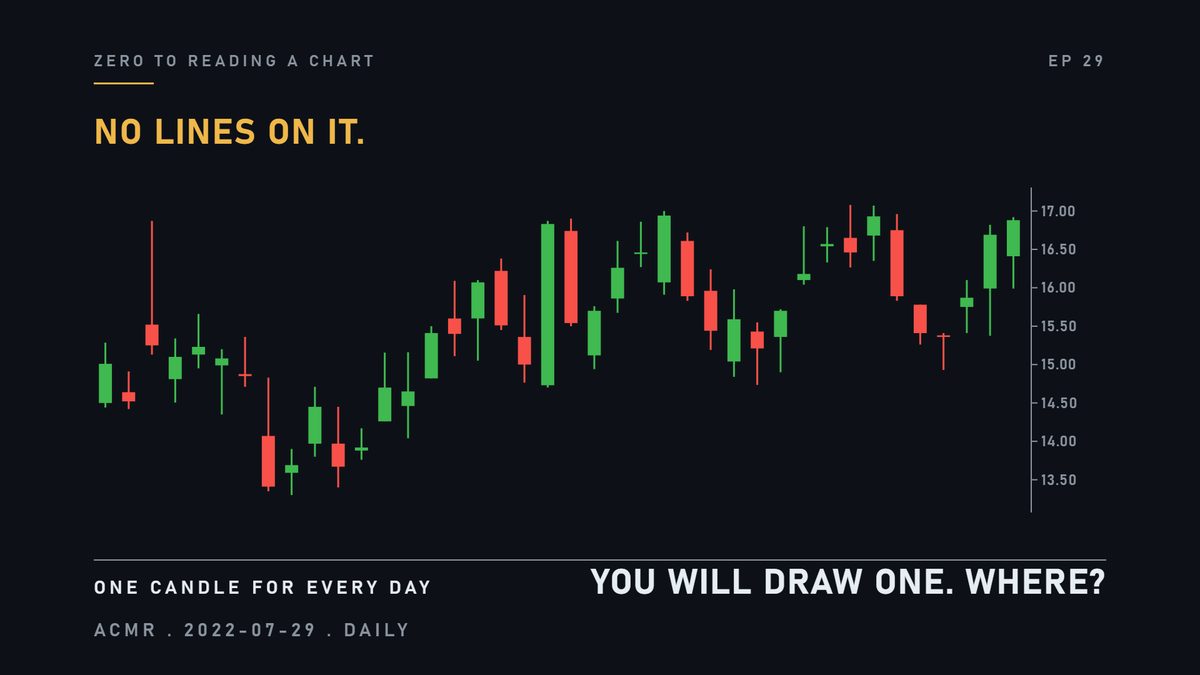
Here is a real chart, with no lines on it. By the end, you will draw one. Where?
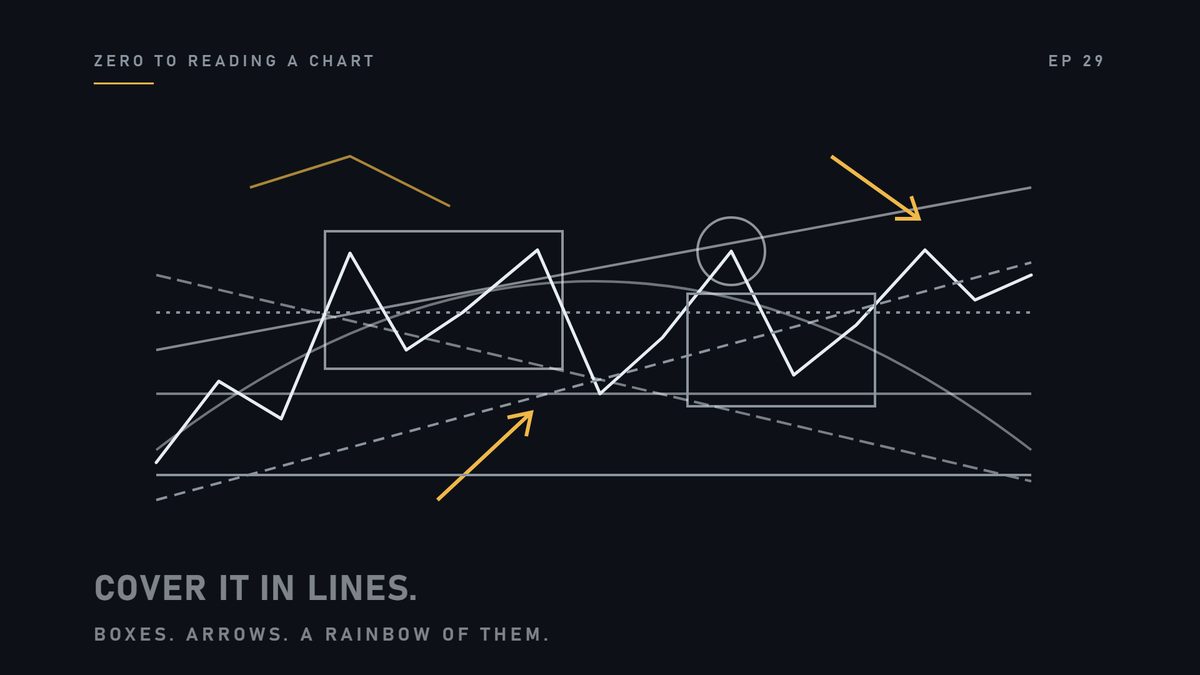
Most people think reading a chart means covering it in lines. Boxes, arrows, a rainbow of them.
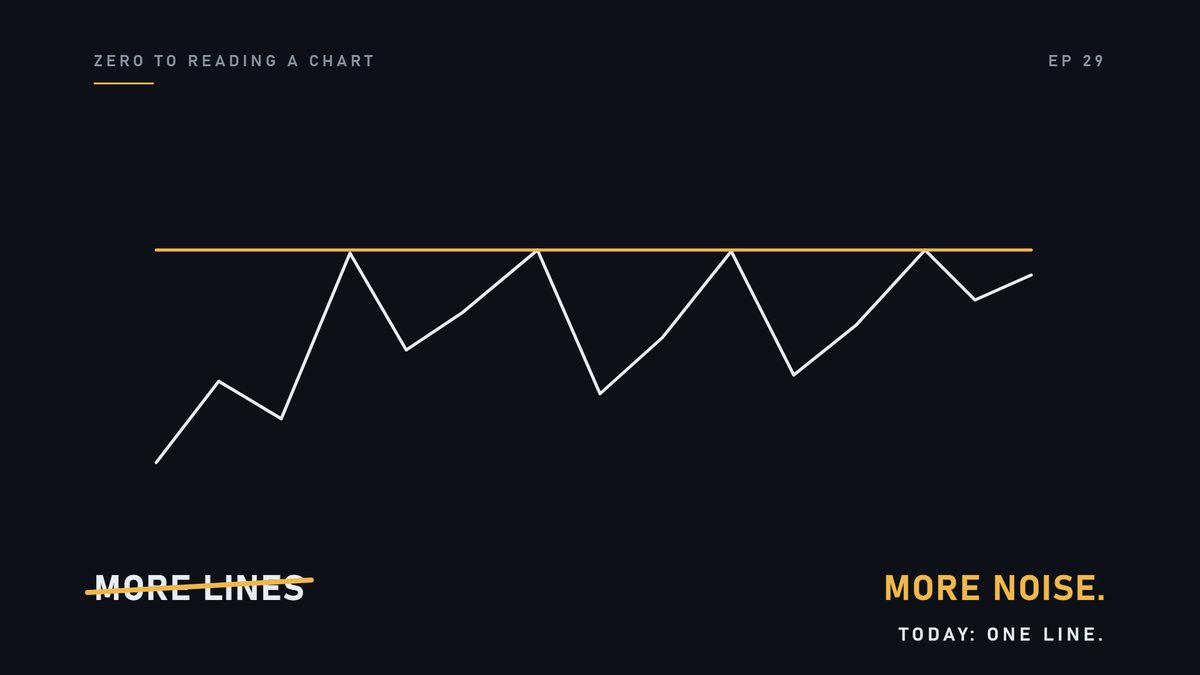
More lines is not more analysis. It is more noise. Today you draw one.
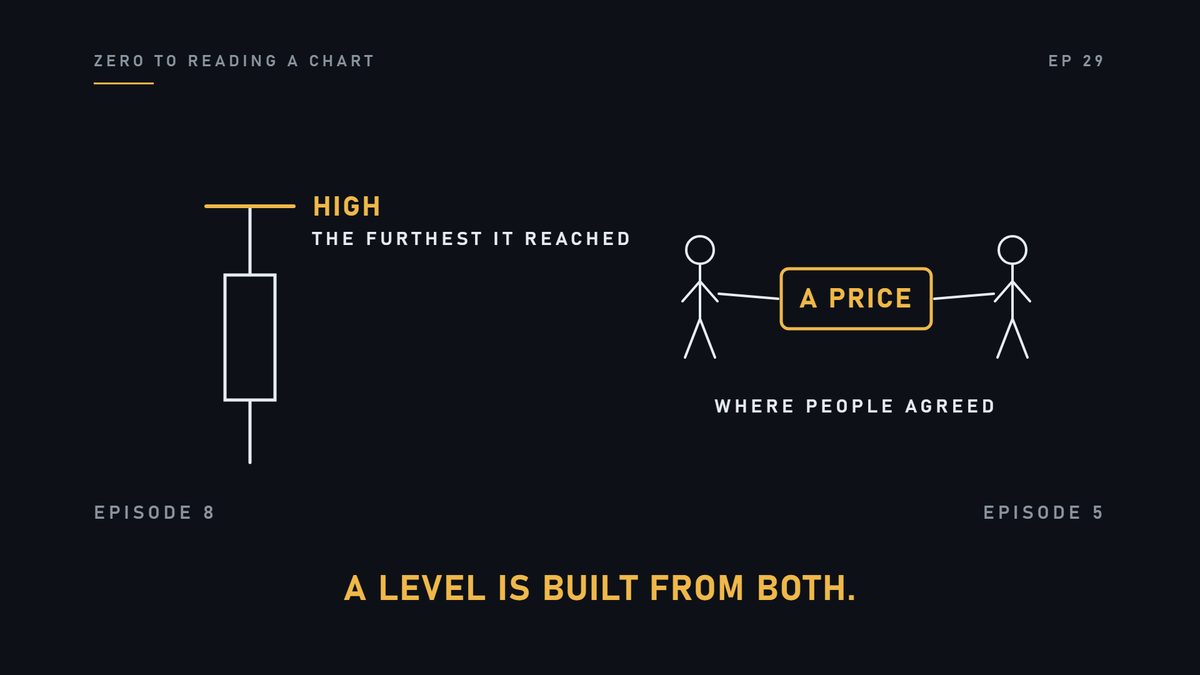
Every candle has a high. And a price is where people agreed. A level is built from both.
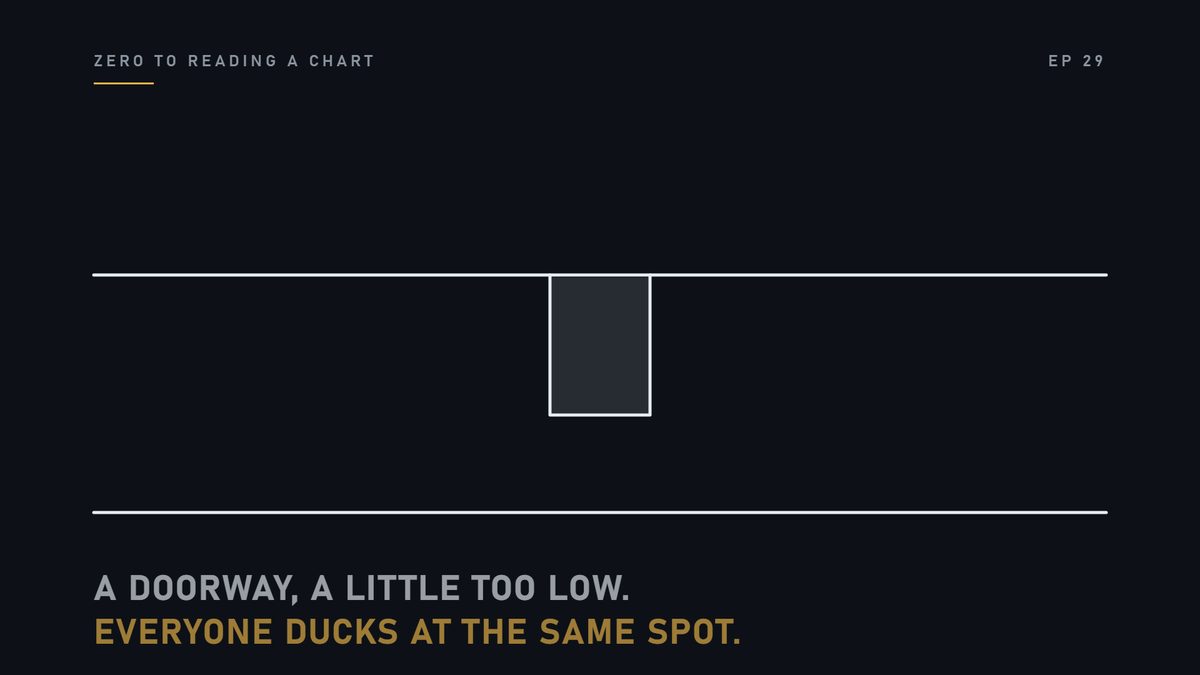
Think of a doorway that is a little too low. Everyone who walks through ducks at the same spot.
Nobody painted a mark there. But you could draw a line at that height.
A level is a price like that. A price where the chart stopped, again and again.
Not because the price is magic. Because a lot of people are watching that number.
Sellers who decided: no higher. Buyers who remember last time.
A level is a price a lot of people are watching. Not a floor, a ceiling, or a force. A crowd's attention, drawn as a line.
Here is the real chart again. Look at the tops of the candles.
Do you see a height where it kept arriving, and kept stopping? Say the price.
Here is the line: seventeen oh eight. If yours is close, you drew what everyone else drew.
Now the strange part. You did not need your eyes at all. Anyone can compute this line, and get the same answer.
Take the last twenty days. Find the highest high among them. That is the twenty-day high.
Watch. The window slides forward a day, and the dot recomputes. Again. Again. No opinion anywhere.
Notice: the chart did not stop at one exact cent. It stopped in a band, about twenty cents wide.
A level is more a zone than a line. Draw the line, but read the zone.
Say it again. A level is a price a lot of people are watching. The twenty-day high is one everyone computes the same way.
Here is the mistake. Somebody draws ten lines. One is always near the price, and it feels like understanding.
Ten lines cannot all be crowds. Draw the one the crowd can see. Our charts stay bare on purpose.
Open any daily chart. Find the highest high of the last twenty candles.
Draw one line there. Just one.
Remember this. A level is a price other people are watching. It is not a floor, a ceiling, or a force.
Check yourself
- What is a level?
- A price a lot of people are watching.
- Why does it matter?
- The chart keeps stopping where the crowd is looking.
- Two people compute one chart's twenty-day high. Same number?
- Yes. Same rule, same number.
Next lesson: same break, not the same.
For learning only. Not financial advice, not signals, not stock picks.