 Trading Reps
Lesson 28 of 31 · Zero to reading a chart
Stock Sectors: Four Companies, Same Day, Same Shape
A sector is a group of companies in the same business; some days the group moves rather than the company, so the sector tells you when to ask whether a chart is about the company or about the group - and never why.
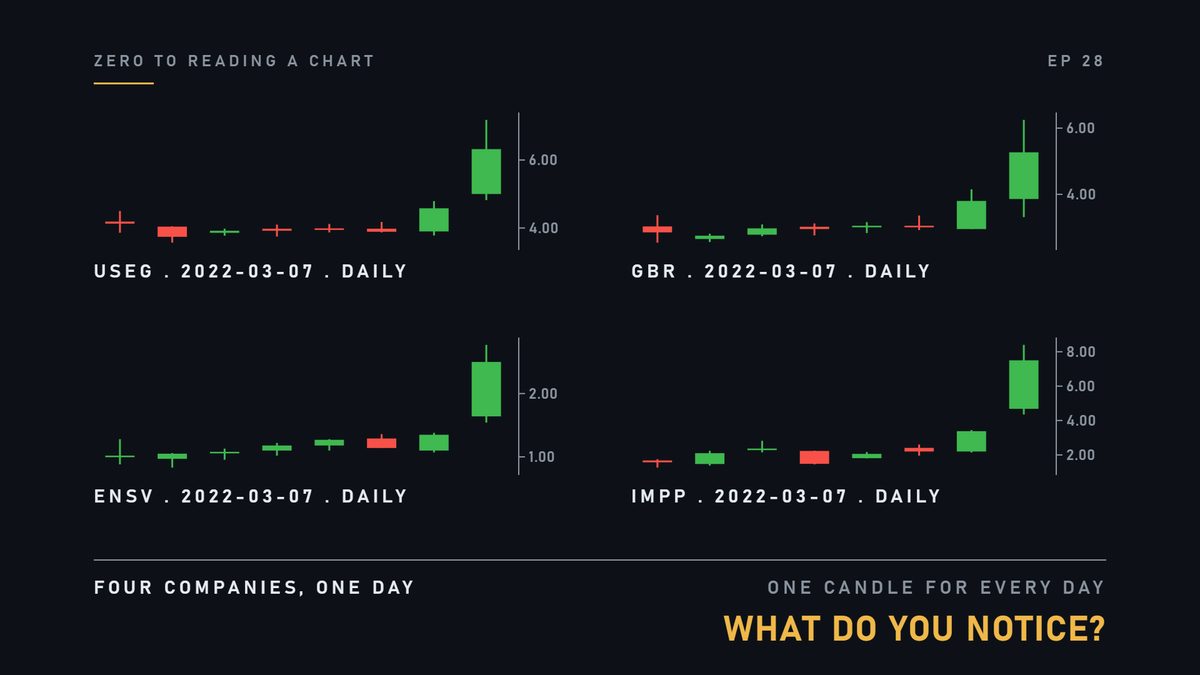
Four different companies, on the same day. Look at the four shapes. What do you notice?
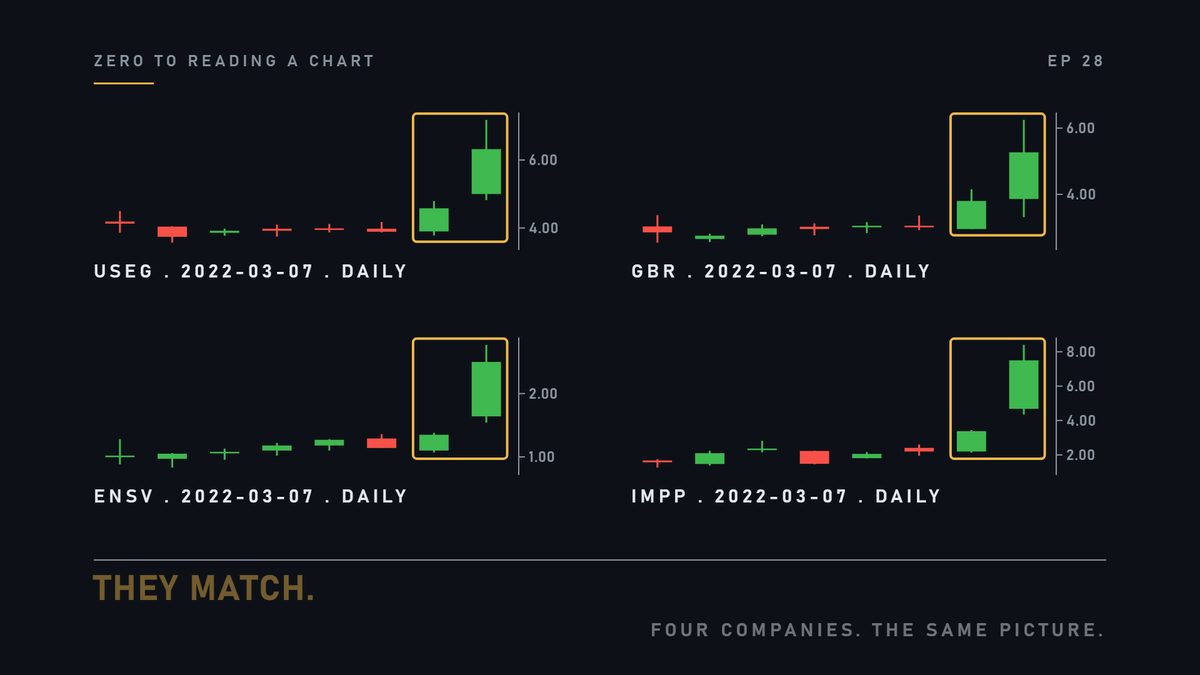
They match. Four companies that have never met. The same picture, on the same day.
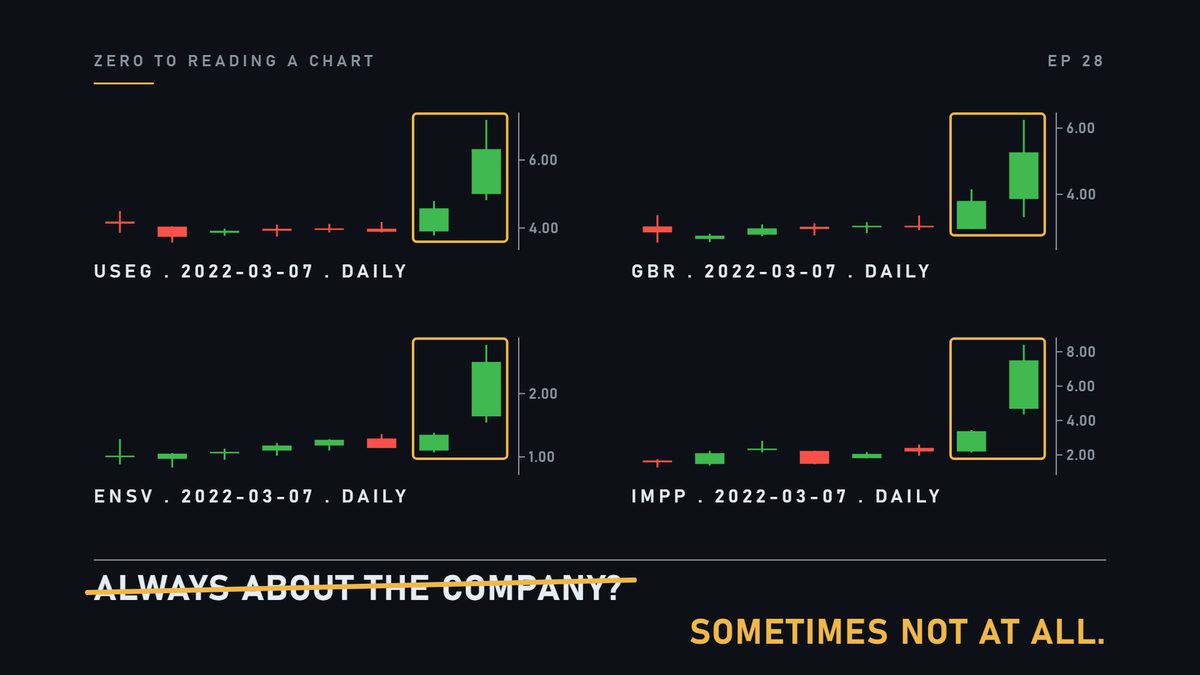
Most people assume a chart is always about the company. Sometimes it is not about the company at all.
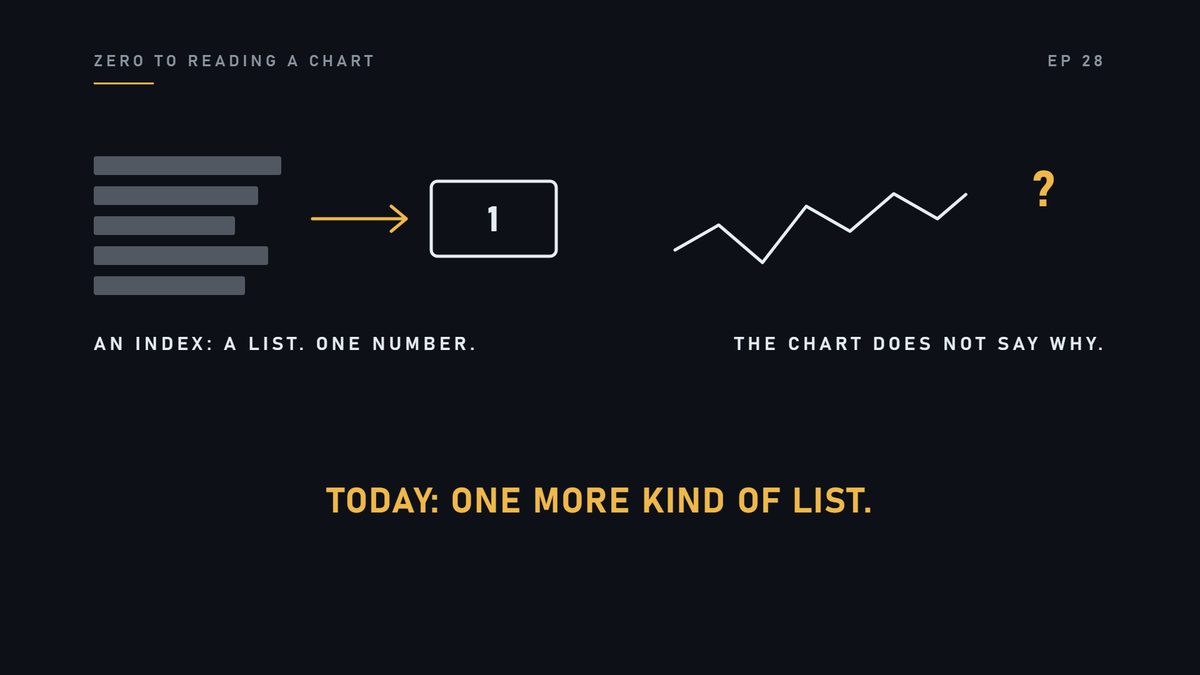
An index is a list of companies turned into one number. And a chart never tells you why. Today, one more kind of list.
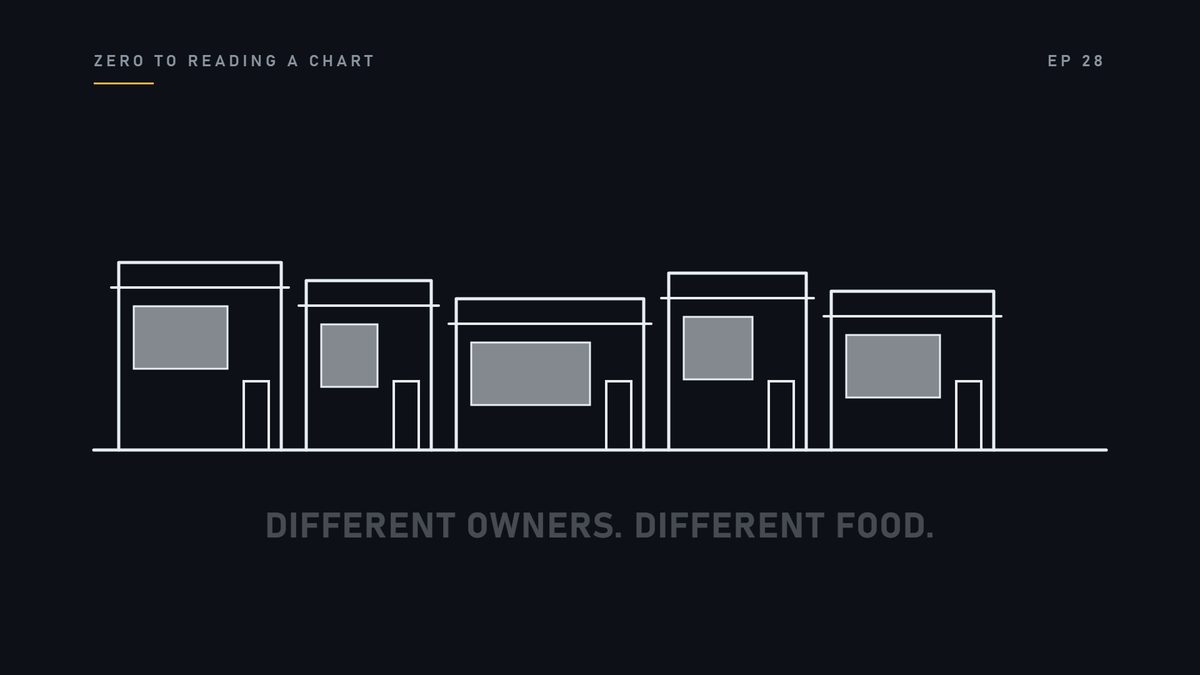
Think of a street of restaurants. Different owners, different food, different prices.
One evening, the road outside is closed. Every restaurant has an empty night. Not because of anything it did. Because of the street.
Companies live on streets like that. Oil companies. Shipping companies. Medicine makers. House builders.
A group of companies in the same business is called a sector.
And some days, the whole group moves. Every company on the street moves with it.
Here are the four again, on that real day. Under each ticker, its sector. The same word, four times.
Look at the last two days on each. Two big green candles, on the same two days.
Now a fifth company, on the same day. A different sector.
Its last day is small. An ordinary day. Whatever moved those four did not touch this one. It was not on that street.
Now the same four again, on a different day, about three weeks earlier.
One up a little. One down. Two barely moved. Four pictures with nothing in common.
On this day, each chart was about its own company. On the other day, it was about the street.
Most days, a chart is about the company.
Some days, it is about the sector. The sector word tells you when to ask.
Here is the mistake. Somebody studies one company carefully, and reads everything about it.
Then the chart does something that has nothing to do with any of it. They were reading the restaurant. The road was closed.
Notice what this does not tell you: why the street moved. The chart cannot say, and we will not guess.
It only gives you the question. Is this the company, or the group?
Next time one stock moves, open two more from the same sector.
See whether they drew the same picture.
Remember this. Sometimes a chart is not about the company at all. Knowing the sector tells you when to ask.
Check yourself
- What is a sector?
- A group of companies in the same business.
- Name two.
- Any two. Oil and shipping, say.
- Every company in one sector rose today. What do you ask?
- Is this the company, or the group?
Next lesson: draw the line before I do.
For learning only. Not financial advice, not signals, not stock picks.