 Trading Reps
Lesson 19 of 31 · Zero to reading a chart
What Is Volume in Stocks? The Row Underneath
Volume is the row under the chart: one bar per candle, the number of shares traded in that candle's window, every trade counted once. Its height is how many people showed up; its colour is only borrowed from the candle above.
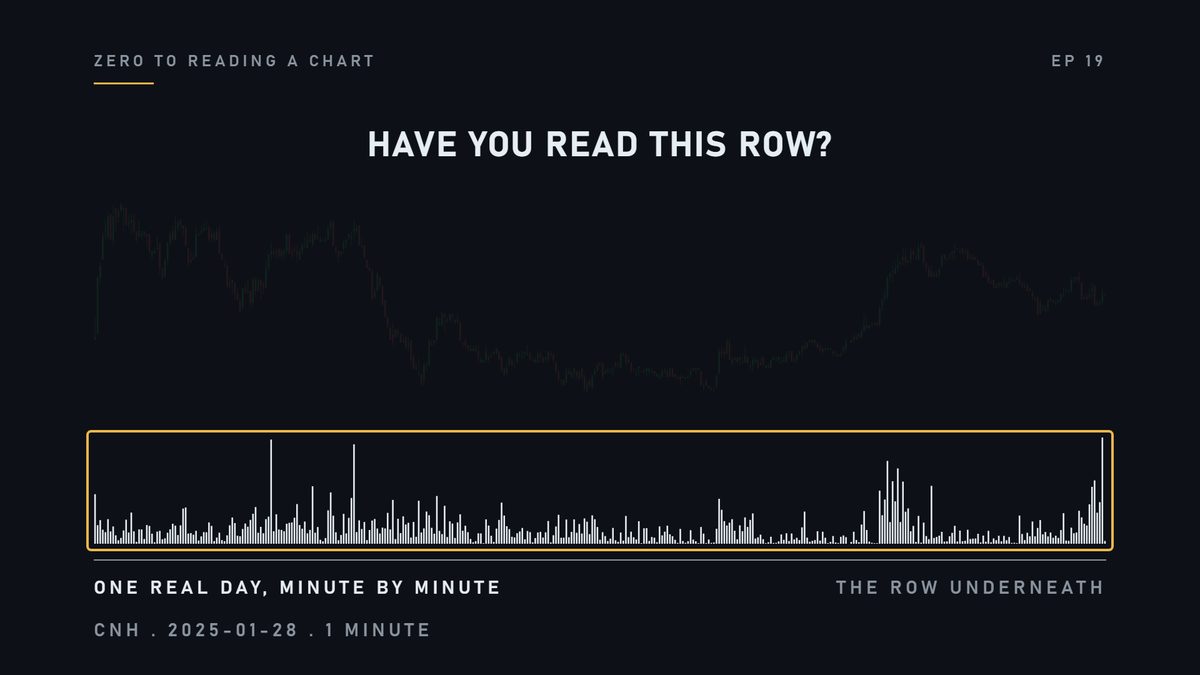
You have been looking at charts for eighteen episodes. Have you read the row underneath, even once?
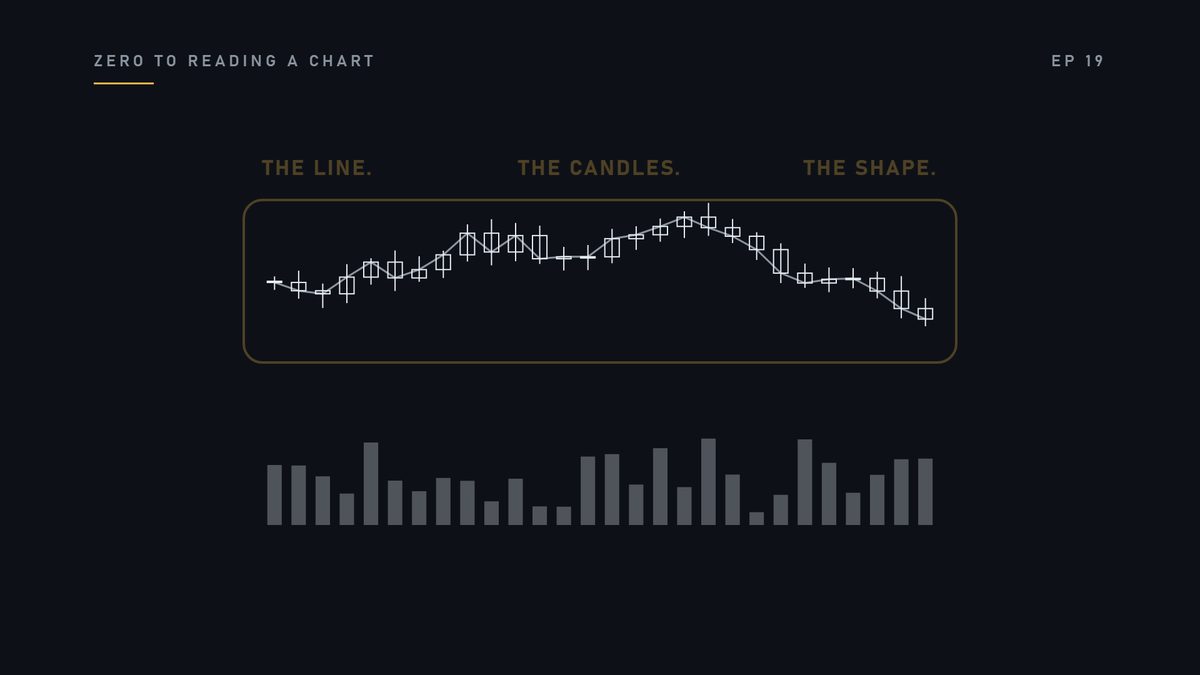
Most people never do. The eye goes to the line, the candles, the shape.
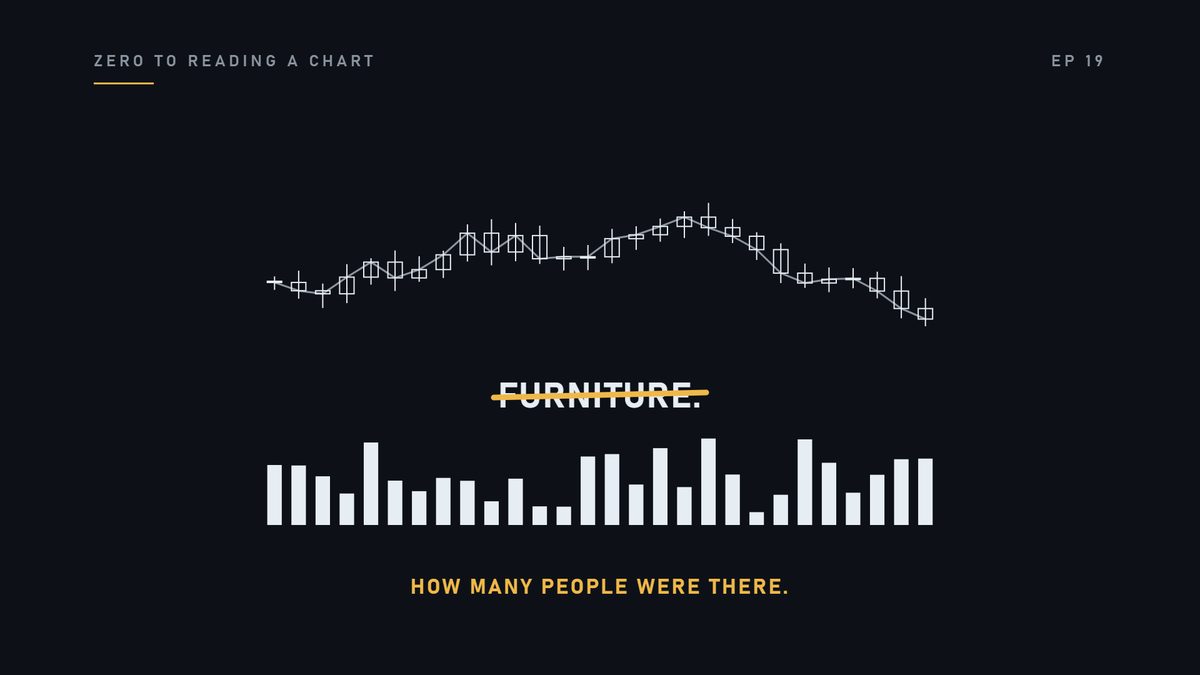
The bars along the bottom are furniture. They are not furniture. Only they tell you how many people were there.
Every price is a trade. Two people agreeing.
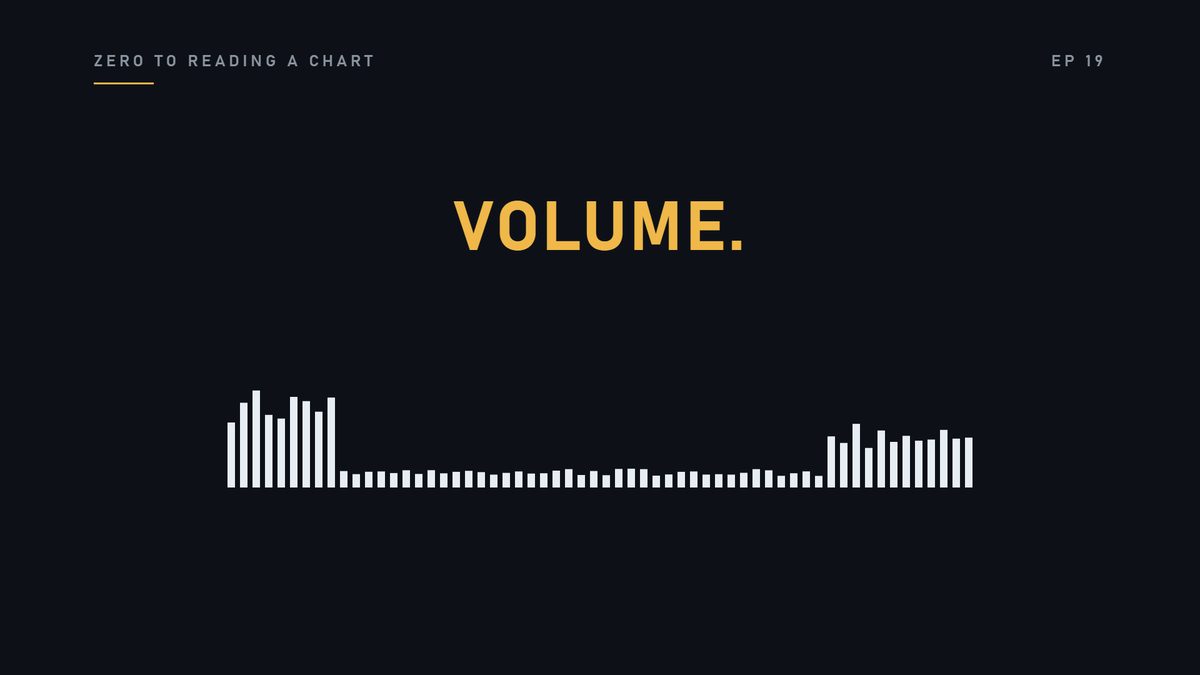
And last time, the row underneath showed you the crowd. Tall at the open, thin at midday. Today that row gets its name. Volume.
Think of a school hall with a line of chairs. Every minute, someone counts the people sitting down. The count becomes a bar.
Tall bar, full hall. Short bar, nearly empty. The people are the trades. The chairs are the shares that changed hands.
That is all a volume bar is. Take one candle.
Count every share that changed hands inside that candle's window. Draw a bar that tall.
One bar per candle, always. On a one-minute chart, a bar is one minute. On a daily chart, a bar is a whole day.
Volume is the number of shares traded in that candle's window. Every trade counted once.
Here is the real thing. A real day, and the row underneath, boxed.
Let us pull one bar out. This one minute, at ten thirty-eight.
The big number is how many shares changed hands in those sixty seconds. The smaller number is how many separate trades it took.
That bar is not a mood. It is a count.
Now watch the day again, with the price dimmed. Busy through the late morning. Quiet after one o'clock.
A burst at half past two. Quiet again. Then a lift into the close. You just read the crowd without a single price.
The price says what happened. The row says how many people showed up.
One more thing, because it catches nearly everyone. The volume bars have colours. Green, and red.
Each bar simply copies the colour of the candle above it. A green bar does not mean more buyers. It means the candle closed higher than it opened.
Turn the colours off, and every bar is exactly as tall. Every trade has a buyer and a seller. Nobody counts them separately.
The row under the chart counts shares traded in each window. Its height is the crowd. Its colour is borrowed.
Here is the mistake. Somebody sees a tall green bar and says, the buyers are in control.
The bar is tall because many shares changed hands. It is green because the candle closed up. Neither one counted a buyer.
Open any chart and cover the price with your hand. Read the day from the row underneath alone.
Remember this. The row under the chart counts shares traded in that candle's window. Every trade counted once.
Check yourself
- What is one volume bar?
- The shares traded in that candle's window.
- Does its colour mean buyers versus sellers?
- No. It copies the candle's colour.
- What does volume add that price does not?
- How many people showed up.
Next lesson: 10M shares is not 10M shares.
For learning only. Not financial advice, not signals, not stock picks.